

Analytics & money
Overview Dashboard
The Overview dashboard is your at-a-glance scoreboard for the selected date range. It answers “how am I doing right now?”
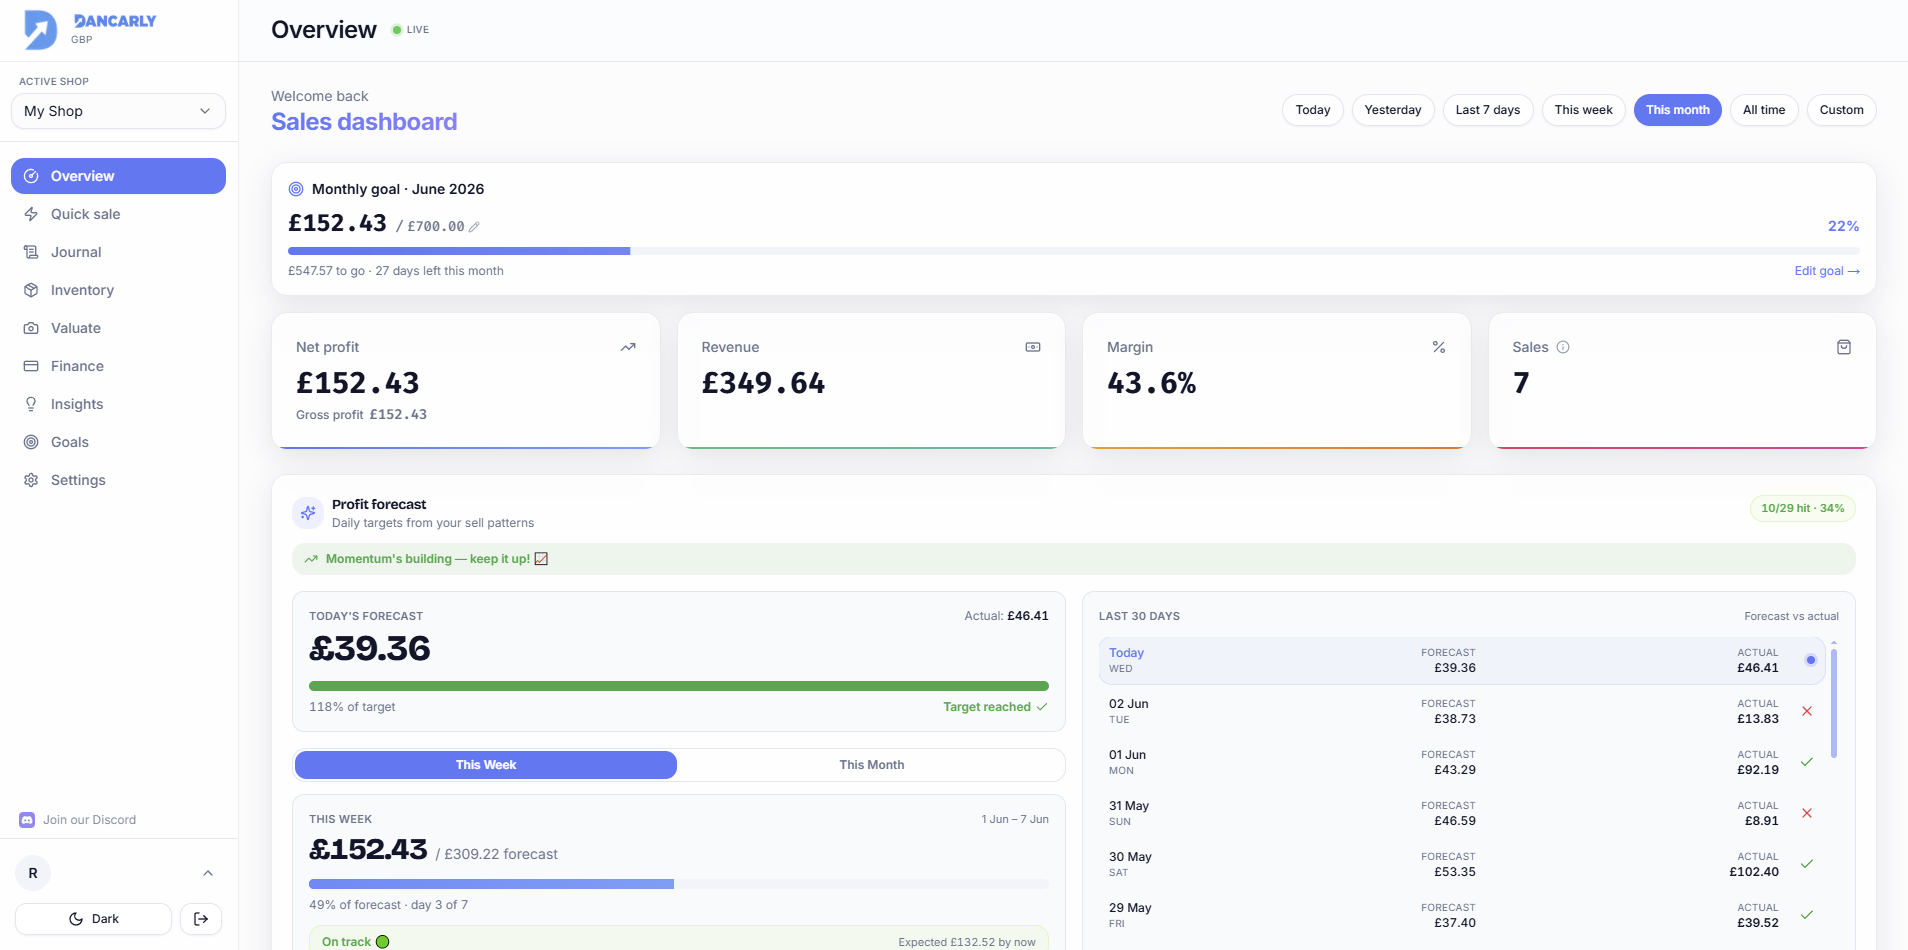
The four stat cards
- Net profit, what you actually made after costs, expenses and refunds (with gross profit shown beneath).
- Revenue, total money taken in from sales.
- Margin, profit as a percentage of revenue.
- Sales, the number of sales recorded in the period.

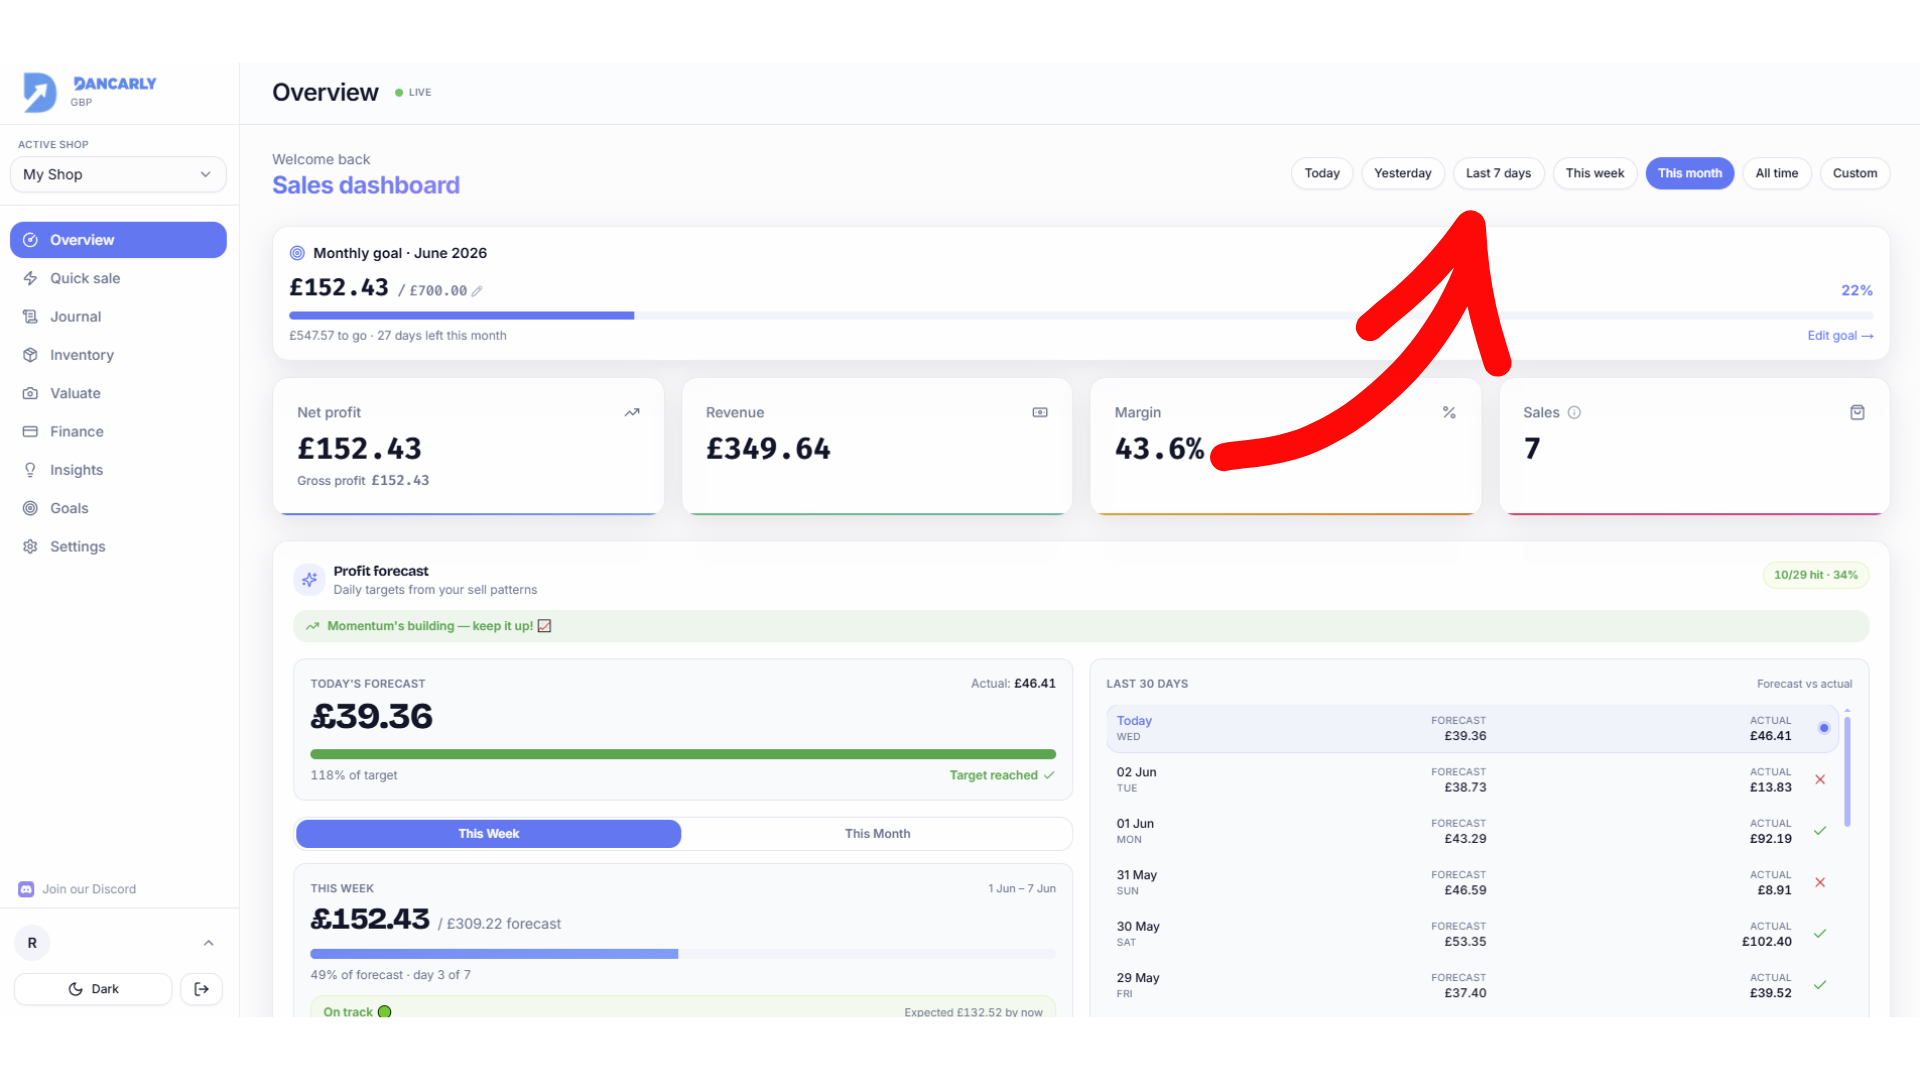
Date range & period summary
Use the date range picker (top right) to switch between this month, last month, custom ranges and more. Lower down, the Period summary breaks the numbers down: units sold, total sales, average profit per item, cost of goods, gross profit, refunds, expenses and net profit.
More on the page
Overview also shows your monthly goal progress, a profit chart over time, top brands and platform performance, and, for Pro users, the daily Profit Forecast.